In line with our efforts to increase transparency, we are sharing an analysis of our Fiscal Year 2025 programmatic grant portfolio.
As a community foundation, SFF grantmaking comes in two forms: 1) donor-advised grants recommended by donors who hold funds with our foundation and are committed to improving life in the Bay Area and beyond, and 2) programmatic grantmaking, which is determined by SFF staff and is one of the main ways we achieve greater racial equity and economic inclusion across the Bay Area.
To better understand the impact of our programmatic grantmaking, we regularly collect, disaggregate, and analyze data about our portfolio. We look at a wide array of characteristics, such as geography, organization size, communities served, and strategy. This helps inform our approach to grantmaking and provides useful context for — and accountability with — our grantees, partners, and funders.
Snapshot of Fiscal Year 2025 Programmatic Grantmaking
July 1, 2024 – June 30, 2025
million granted
grants
organizations
individuals
average grant size
executive directors identify as BIPOC
Some key data points which emerged from this year’s analysis are:
- Grants: Our grants ranged in size from $1,000 to $2.2 million, with an average of $85,000. 62% of total grantmaking dollars went to grants lasting more than one year. Of our strategies, Policy and systems change received the most funding at $7.3 million.
- Organizations: Organizations with budgets of over $1 million received, on average, larger grants than smaller organizations with budgets under $1 million. 81% of grantee partners had an executive director who identified as Black, Indigenous, or a Person of Color (BIPOC), and 68% of grantees were BIPOC-led.*
- Communities served: 96% of our grantee partners are working to improve outcomes for communities that are predominantly Black, Indigenous, and people of color. Additionally, $18.3 million went to organizations serving a community that is majority low-wage workers.
- Geography: Organizations working in centrally-located Bay Area counties (Alameda, San Francisco, and Contra Costa) received the majority of funding.
See below for additional insights and the complete data charts.
*A “BIPOC-led” organization is one in which the following identify as Black, Indigenous, or people of color: 1) the executive director, 2) over 50% of the organizational leadership, and 3) over 50% of the board. Information about organizational leadership is collected, but it is not used for any funding decisions.
Data and Methodology
This analysis covers grants made from July 1, 2024, to June 30, 2025, and is based on data collected from SFF’s grant applications. This report analyzes the data across all SFF programmatic grantmaking. It examines total funding and grant sizes based on organizational characteristics (such as grants to BIPOC-led* organizations, including their EDs, organizational size) and grant types (length, strategies). Data completeness across grantee organizations varied from 81% (community groups served) to 88% (race/ethnicity of the executive director, organizational budget, and region served). Across all grants, 65% had information available on strategies, covering 79% of programmatic grantmaking dollars. Grants portfolio data as of July 22, 2025.
Download this list to see all funded organizations and individuals.
Grants
Funding By Strategy
We fund many interconnected strategies to make our region more equitable, healthier, happier, and more prosperous. Of our strategies, Policy and systems change received the most funding at $7.3 million, followed by $6.8 million for housing (tenant protections/homelessness prevention, affordable housing preservation, and production), and $6.2 million for movement building and community organizing.
Grant Length
Most grants (65%) lasted 6-12 months, with 24% lasting more than a year. In total, 62% of total grantmaking dollars went to grants lasting more than one year.
Organizations
Budget and Funding
Just under half of the organizations funded had annual budgets of up to $1 million (46%), and nearly a quarter had budgets over $5 million (22%). Larger organizations with budgets of over $1 million received, on average, larger amounts of funding than smaller organizations with budgets under $1 million.
Annual Budget
Average Funding/Organization by Organization Size
BIPOC-led Organizations
Across organizations with available data, 81% had executive directors who identified as BIPOC, and 68% were BIPOC-led (defined as the executive director, over 50% of the organization’s leadership, and over 50% of the board identify as BIPOC). This includes data for organizations with co-executive directors.
Executive Director (% identifying as BIPOC)
BIPOC-led Organizations (%)
Dollars Funded
White-led organizations received the most funding ($13.2 million), followed by Black-led organizations ($12.6 million), Latinx-led organizations ($12.1 million), and Asian and Pacific Islander-led organizations ($8.0 million).
Race/Ethnicity of Executive Director (both EDs included)
Communities
Funding to Organizations by Majority Community Group Served
Grantees report on the characteristics of the communities they serve, both in terms of race and ethnicity and other characteristics (e.g., low-wage workers or formerly incarcerated).
Organizations working with majority low-wage workers received the most funding, $18.3 million, followed by girls and women of color ($11.7 million) and immigrants ($8.7 million).
Because community groups may overlap, total funding in the Funding to Organizations by Community Groups Served sums to more than the total of our programmatic grantmaking.
Funding to Organizations by Majority Race/Ethnicity Group Served
In looking at data related to the race and ethnicity of the communities served, 96% of grantees served a community with a majority of Black, Indigenous, and People of Color (BIPOC) community members. Organizations working with majority Latinx communities received $7.3 million in funding, followed in amount funded by majority Black communities ($5.9 million), and majority Asian or Pacific Islander at $1.2 million.
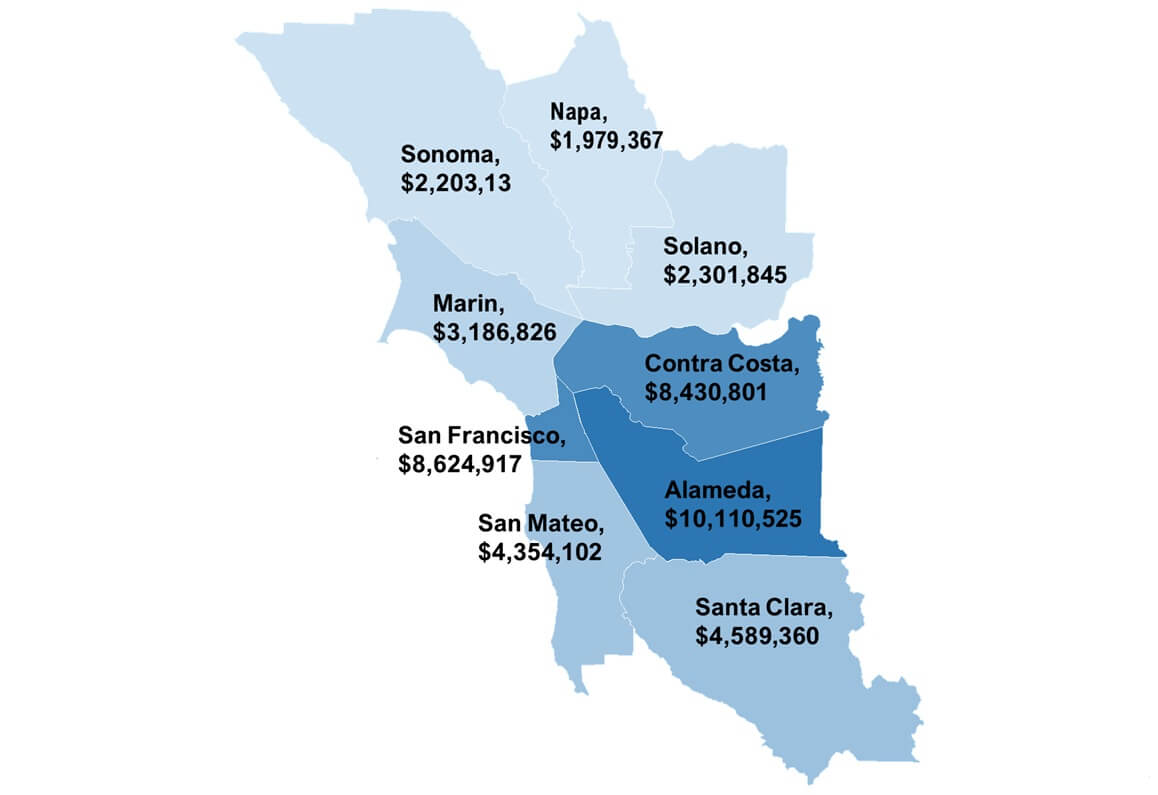
Geography
Funding Per County
We fund organizations working across the nine-county Bay Area. The majority of funding went to organizations working in three centrally located counties: Alameda, San Francisco, and Contra Costa.
For organizations working in multiple counties, funding is allocated equally across all counties in which they work.