San Francisco Foundation is fulfilling our promise to be more transparent, to publish our grants, and to hold ourselves publicly accountable to our values and aspirations. Grantmaking is one of the main ways we advance our racial equity mission, and we want to be clear about where we are hitting the mark, where we are missing it, and what we are committed to change.
As a community foundation, SFF grantmaking comes in two forms: 1) as donor advised grants recommended by donors who hold funds with our foundation and are committed to improving life in the Bay Area and beyond 2) as equity-focused, or programmatic, grantmaking determined by SFF staff.
To better understand the impact of our equity-focused grantmaking, we regularly collect data and analyze our grantmaking portfolio. While past analyses have been limited, in 2022 we launched a comprehensive grantee perception survey and analysis that allows us to disaggregate data by race/ethnicity, geography, organization size, and strategy. This analysis will inform our internal decision-making about grants and will provide useful context and accountability with our grantees, partners, and funders.
Read more about the launch of the 2021 grants data in a blog post by our Chief Impact Officer, Judith Bell.
We invite you to review our 2021 grants data, which offers a snapshot of the foundation’s program grants from our People, Power, Place, Policy and Innovation, and Strategic Learning and Evaluation teams.
2021 Equity Grantmaking Data Snapshot(July 1, 2021 to June 30, 2022) |
| $46.7 million granted |
| 521 Grants |
| 387 Organizations |
| 9 Individuals |
| $90K Average grant size |
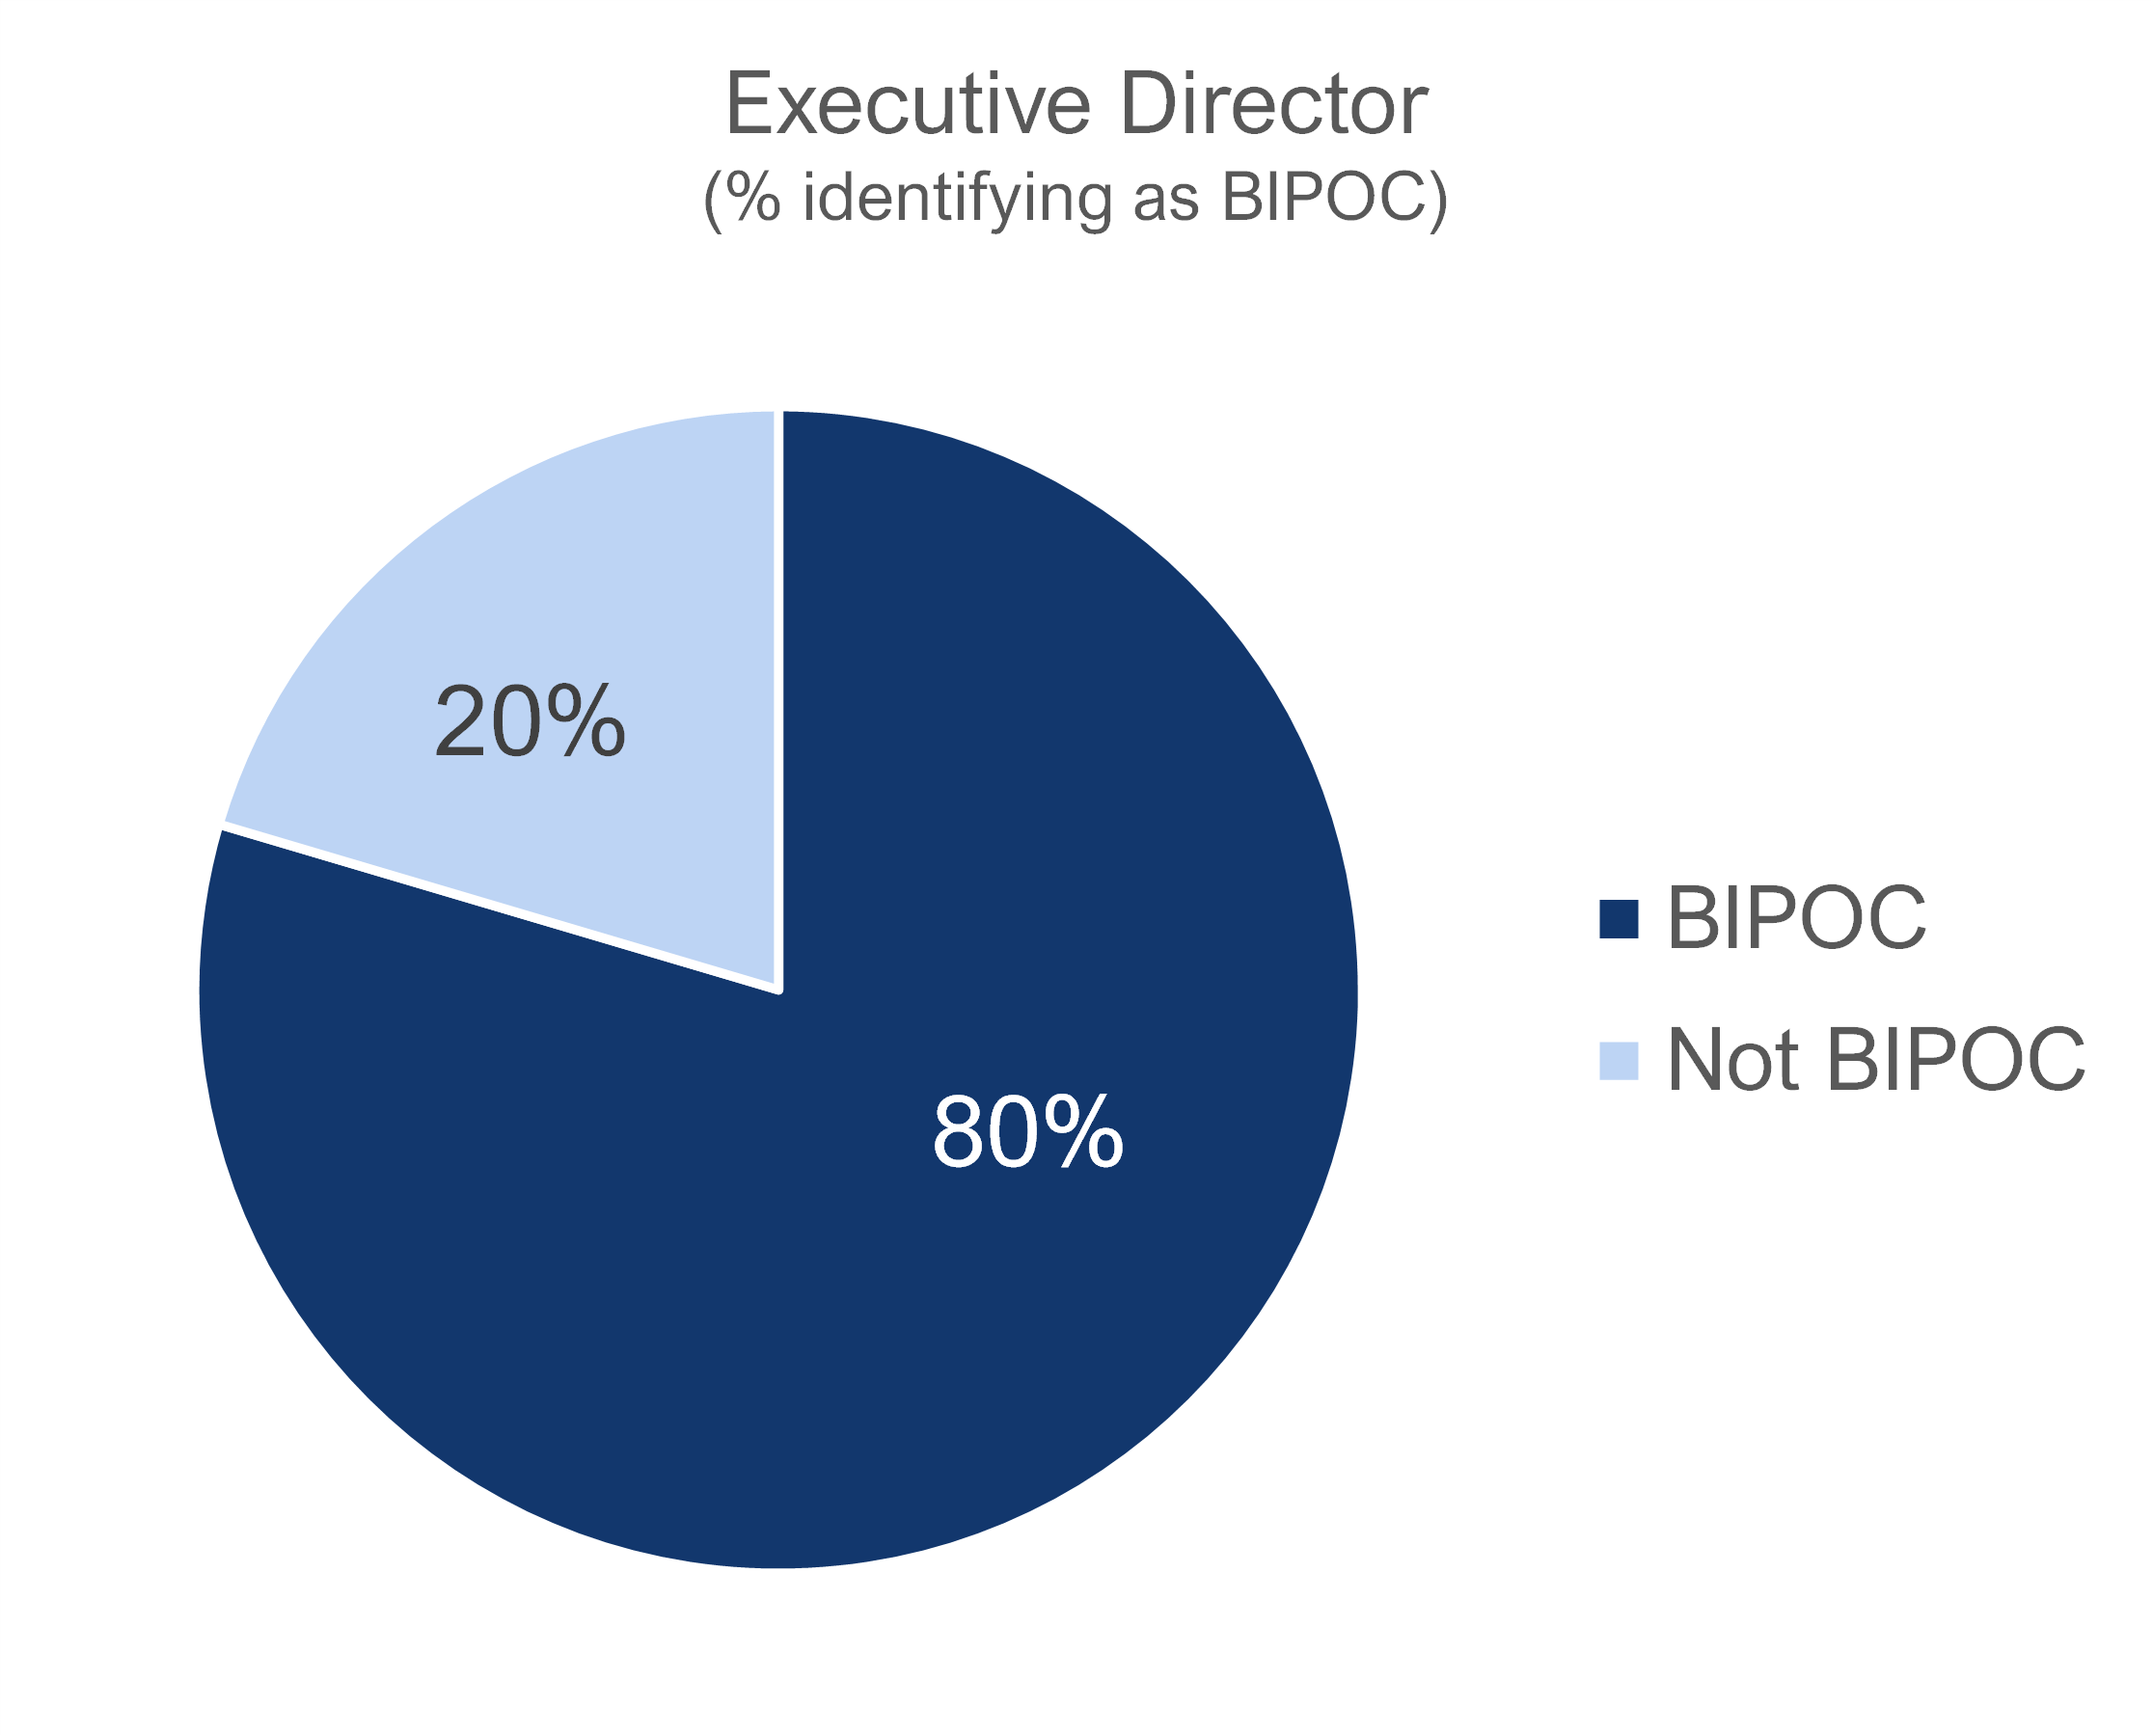
| 80% of Executive Directors identify as BIPOC* |
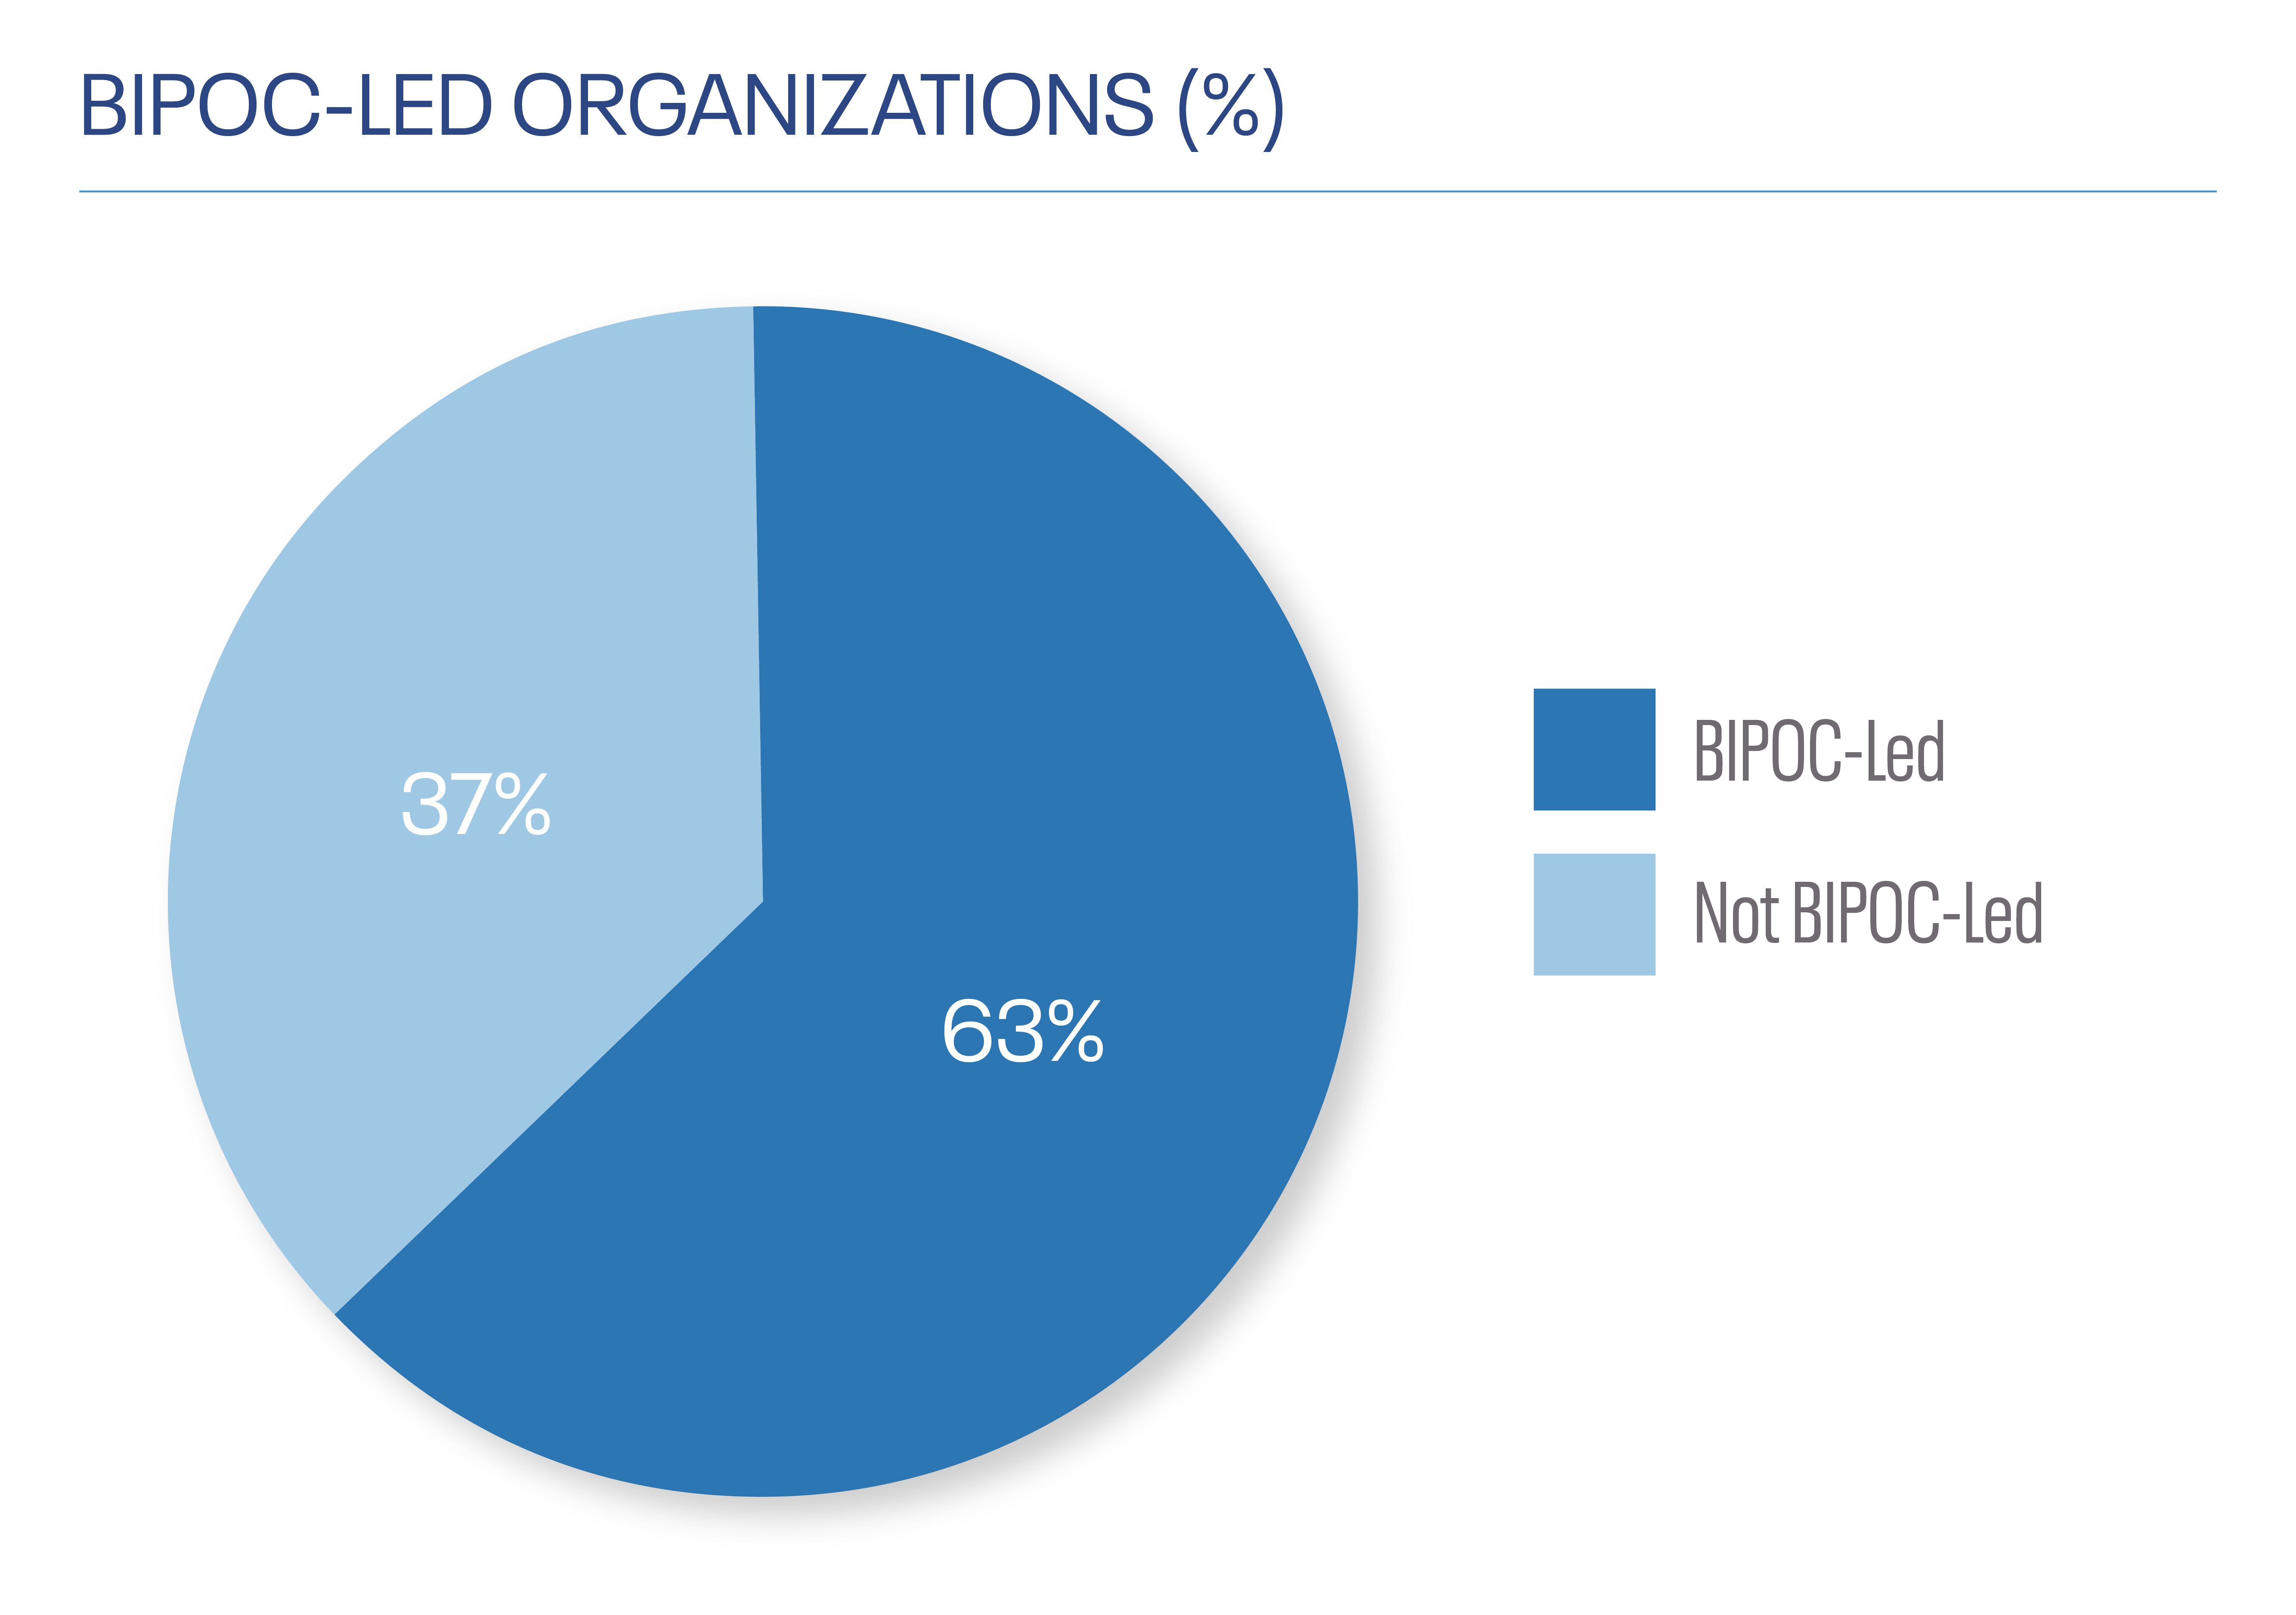
| 63% of Organizations are BIPOC-led* |
| 95% of Organizations serve majority BIPOC communities |
Data excludes organizations and grants for which information was not available.
*BIPOC-led is defined as 1) the Executive Director identifies as BIPOC, 2) more than 50% of the organizational leadership identifies as BIPOC, and 3) more than 50% of the Board identifies as BIPOC.
Click on the sections below to learn more. Download this list to see all funded organizations and individuals.
Grants
We fund a wide range of interconnected strategies that work together to make our region more equitable, healthier, happier, and more prosperous. Grants made from July 2021 to June 2022 that supported our four interconnected focus areas – People, Place, Power, and Policy and Innovation – received the most funding at $7.6 million, followed by policy and systems change with $7.1 million and movement building and community organizing with $6.9 million.
We made 521 grants to 387 organizations and 9 individuals. Grants ranged from $600 to $2.7 million. The average grant was $90K.
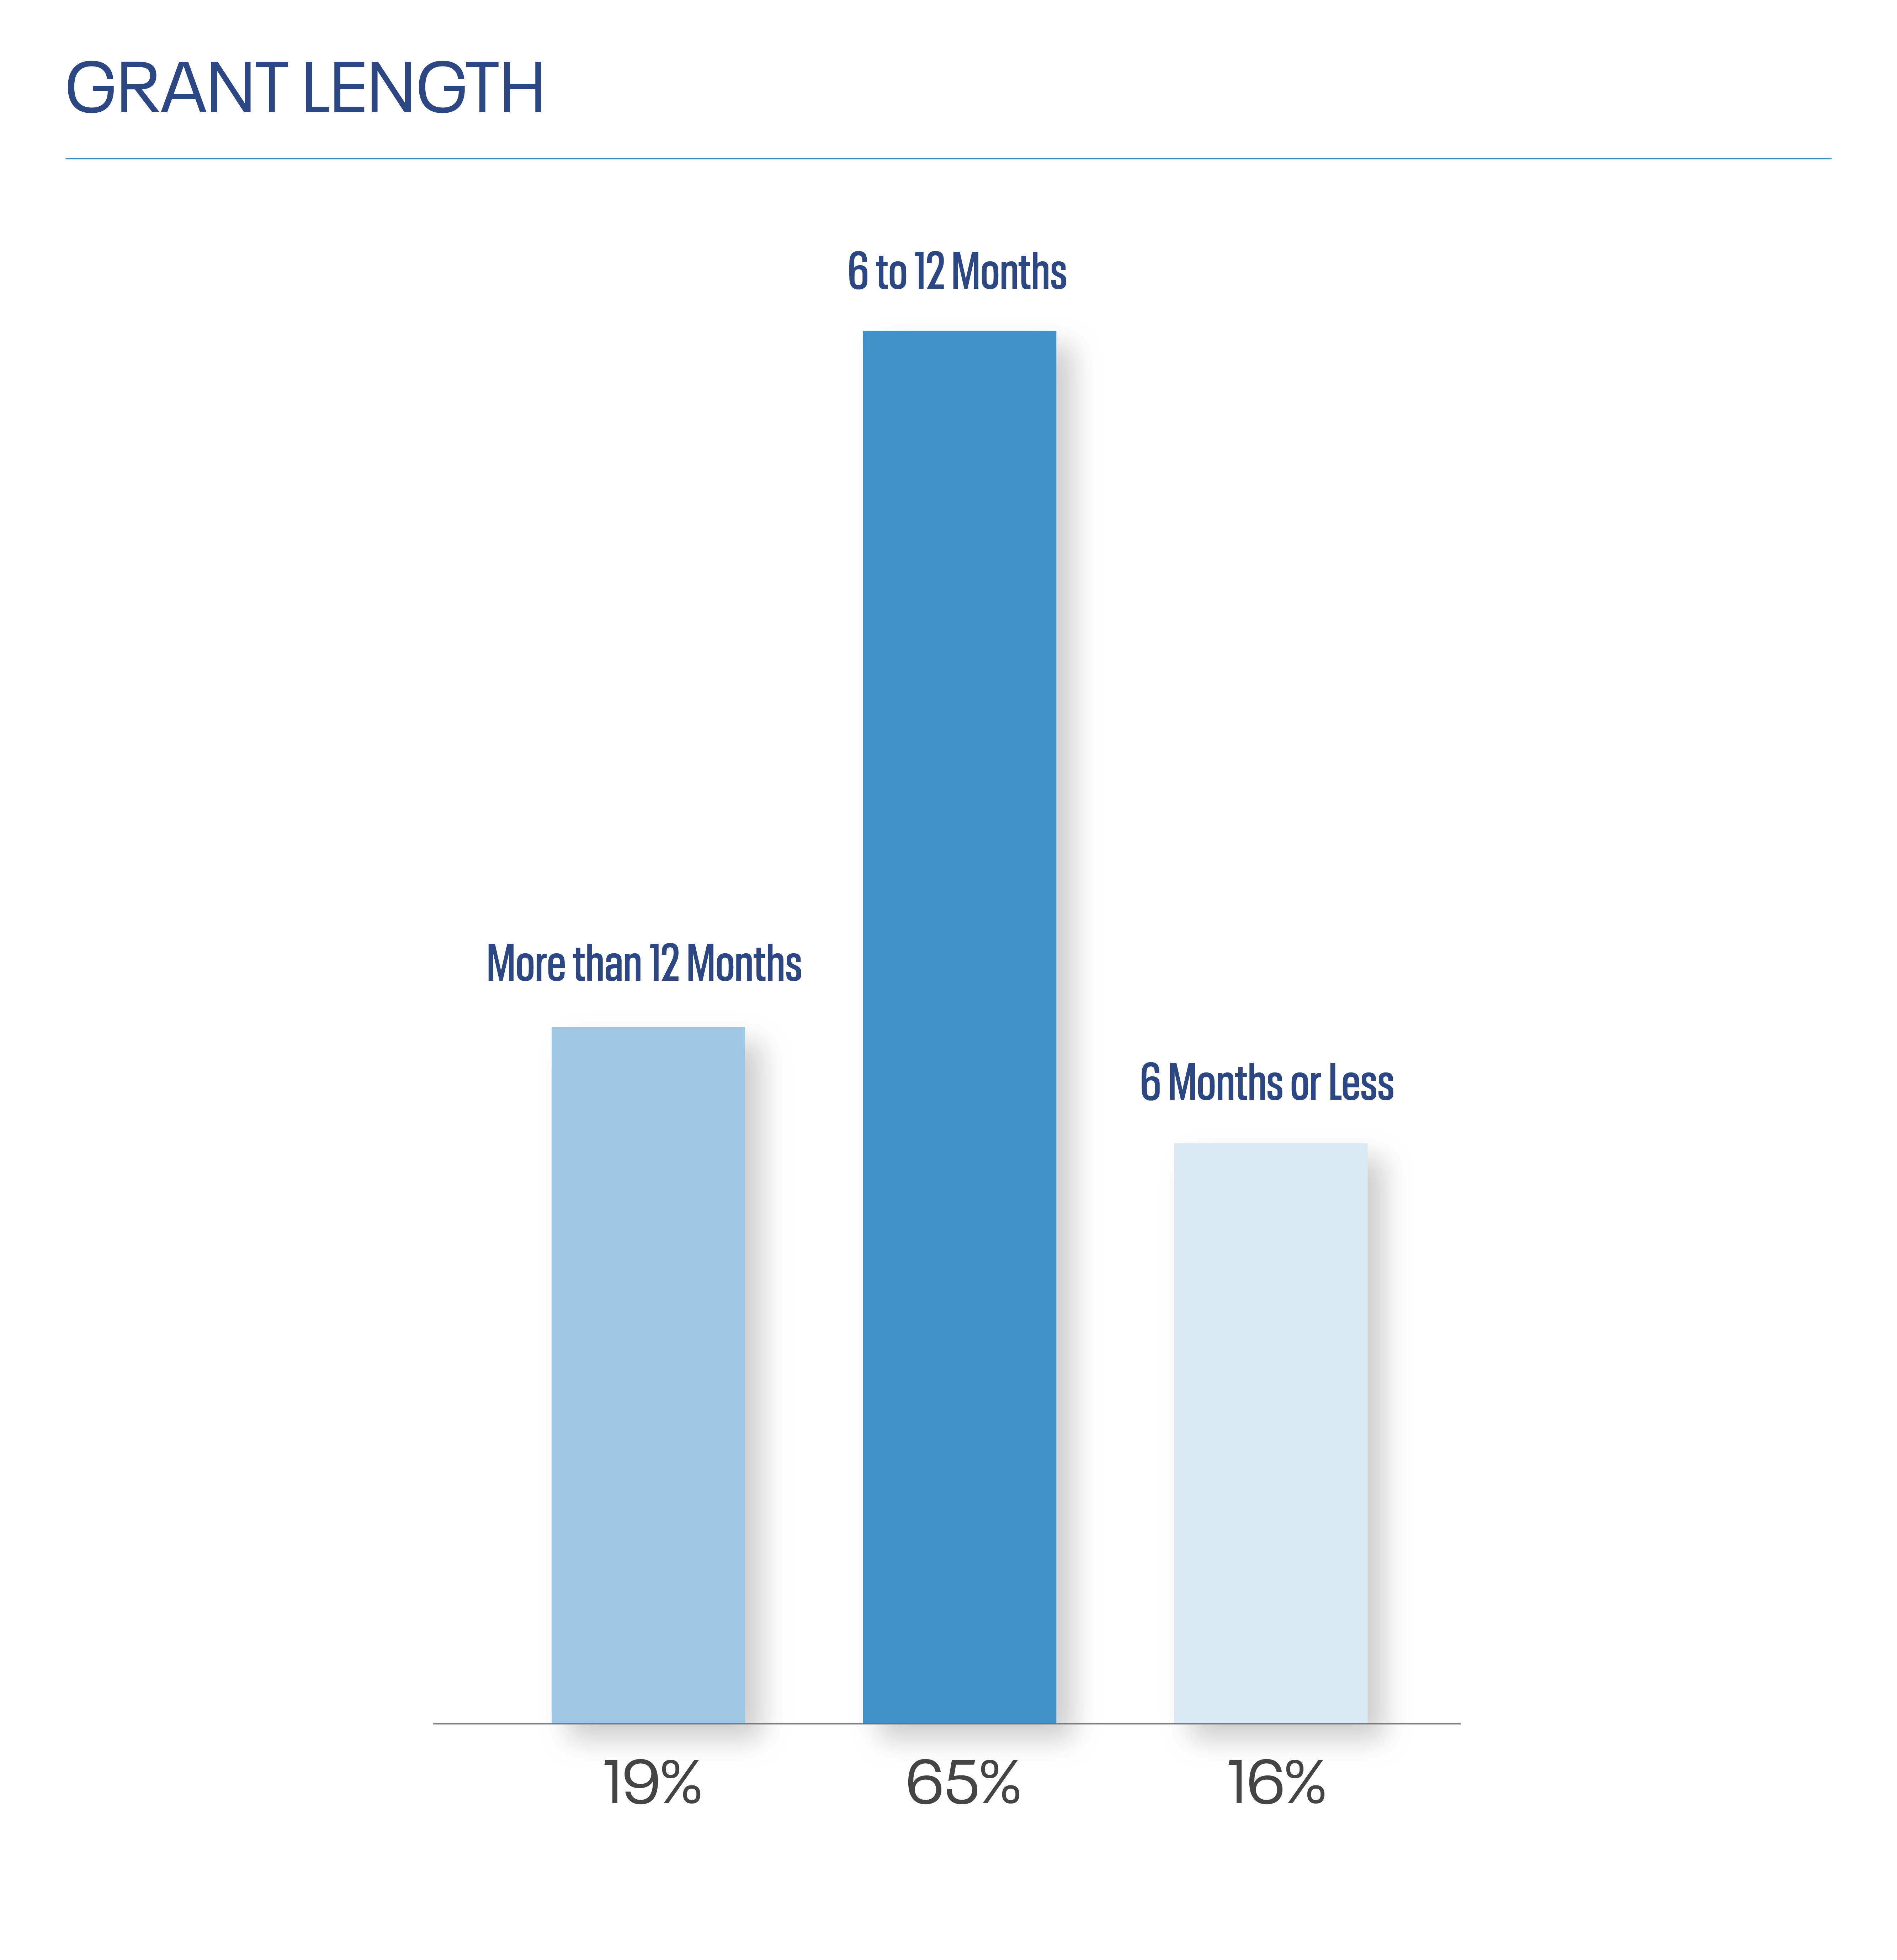
The majority of grants lasted from 6-12 months (65%) with 19% of grants lasting more than a year.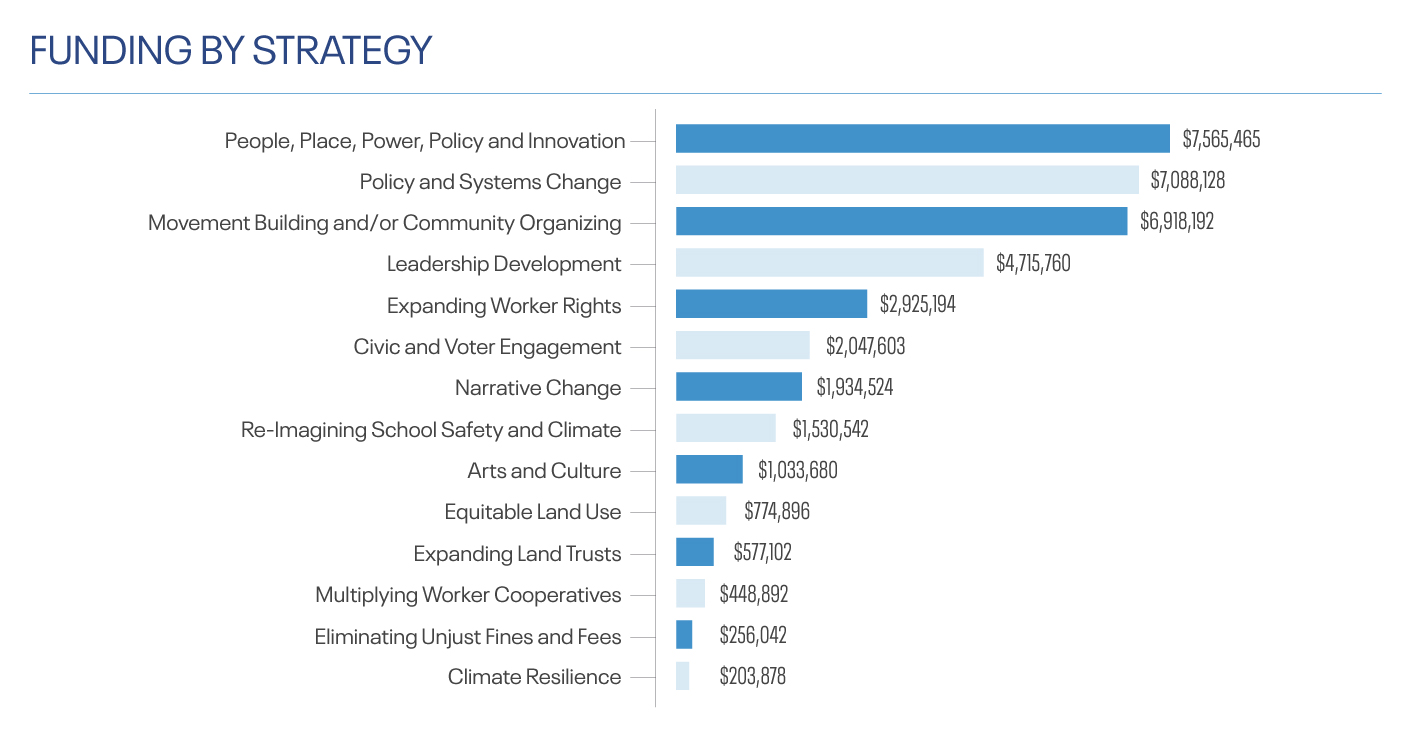
Organizations
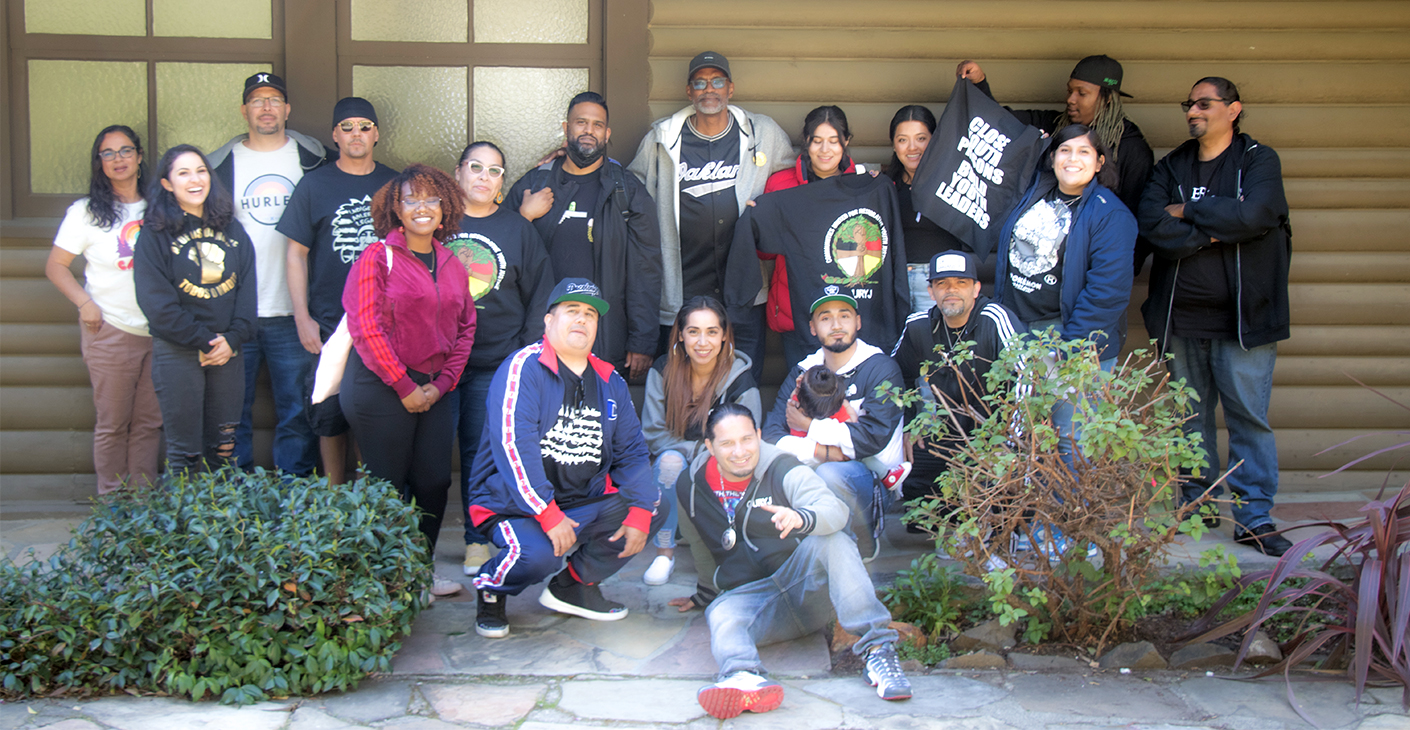
Across organizations with available data, 80% had Executive Directors who identified as BIPOC and 63% were BIPOC-led (defined as the Executive Director identified as BIPOC, greater than 50% of the organization leadership identified as BIPOC, and greater than 50% of the board identified as BIPOC).
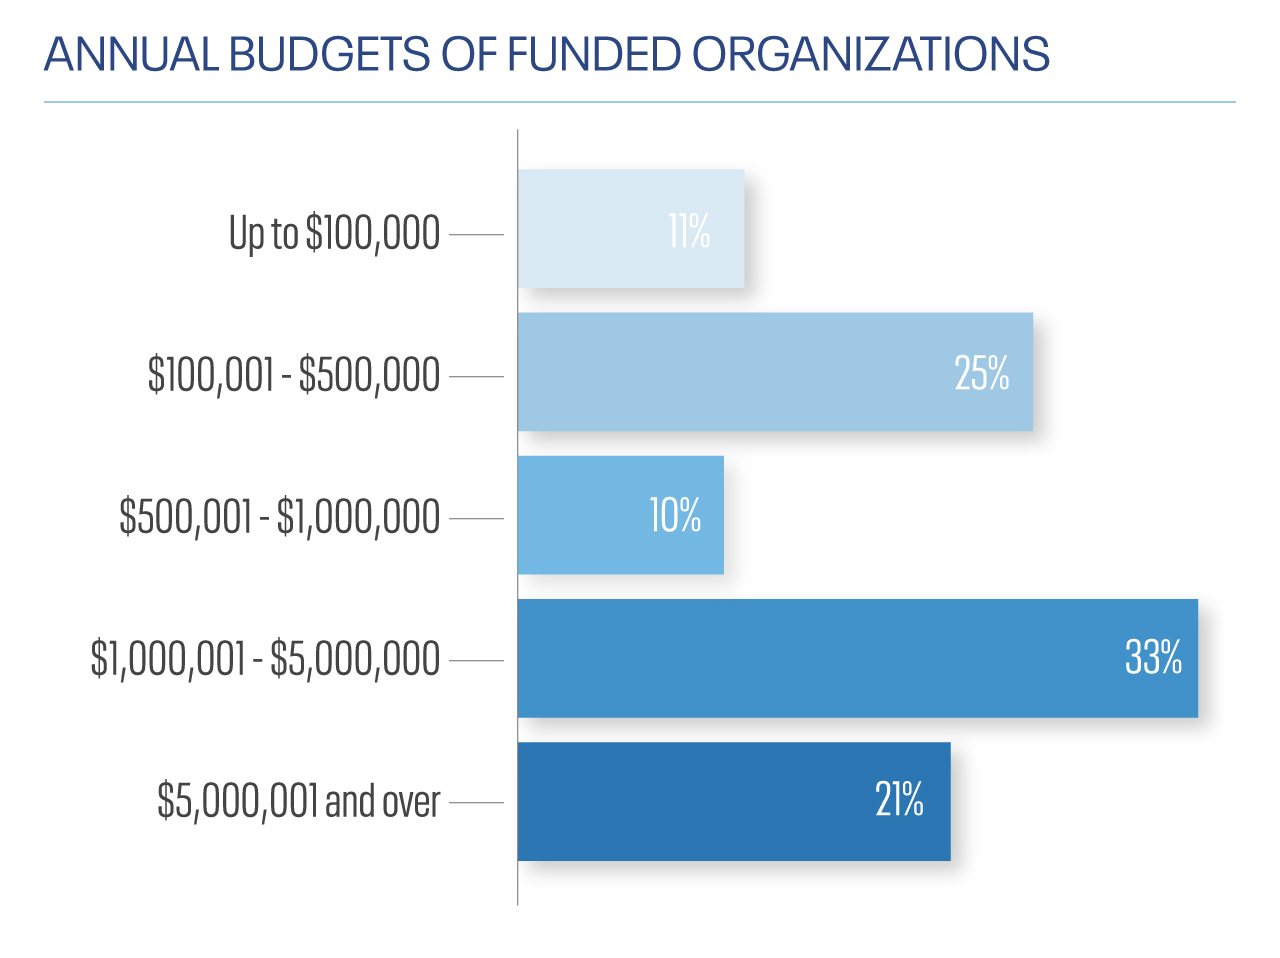
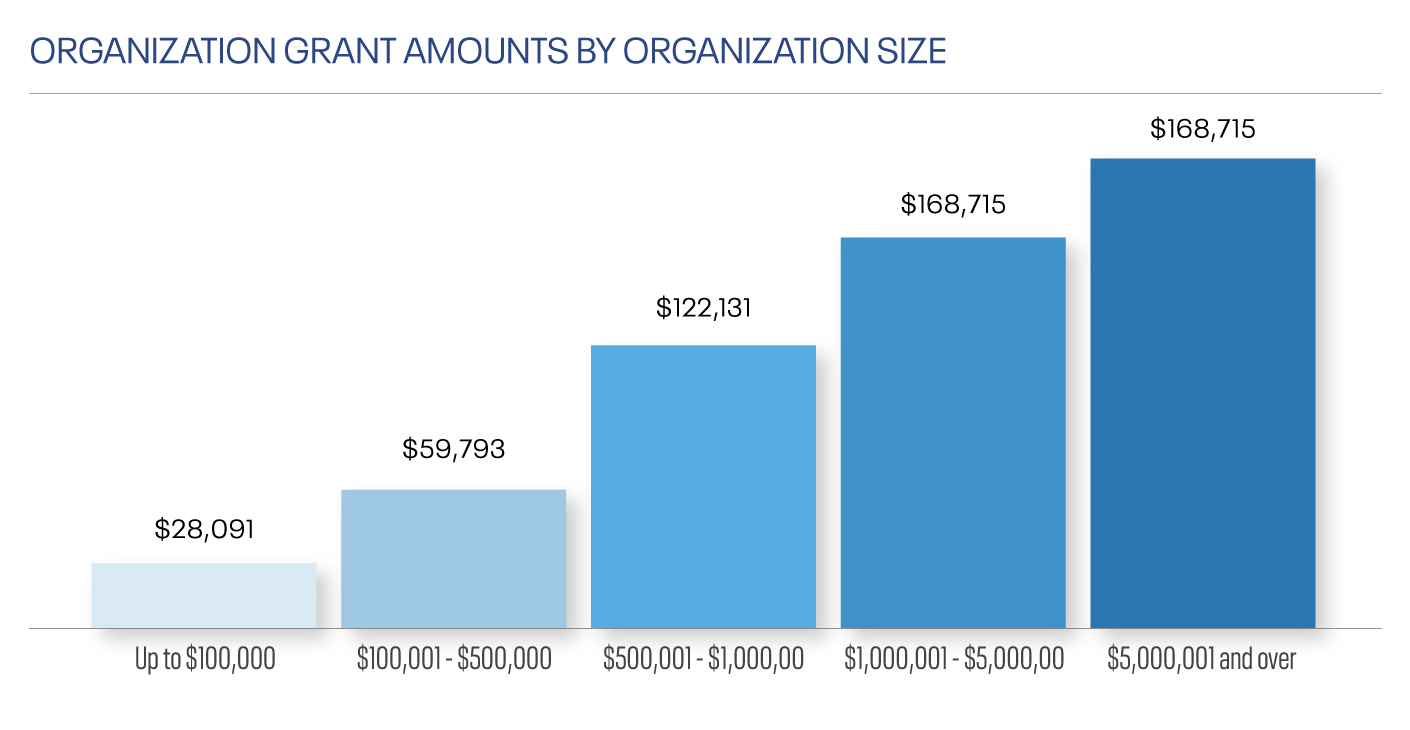
Nearly half of the organizations had annual budgets of up to $1 million (46%) and just over a quarter had budgets over $5 million (21%). Larger organizations received, on average, more funding than smaller organizations.
Communities
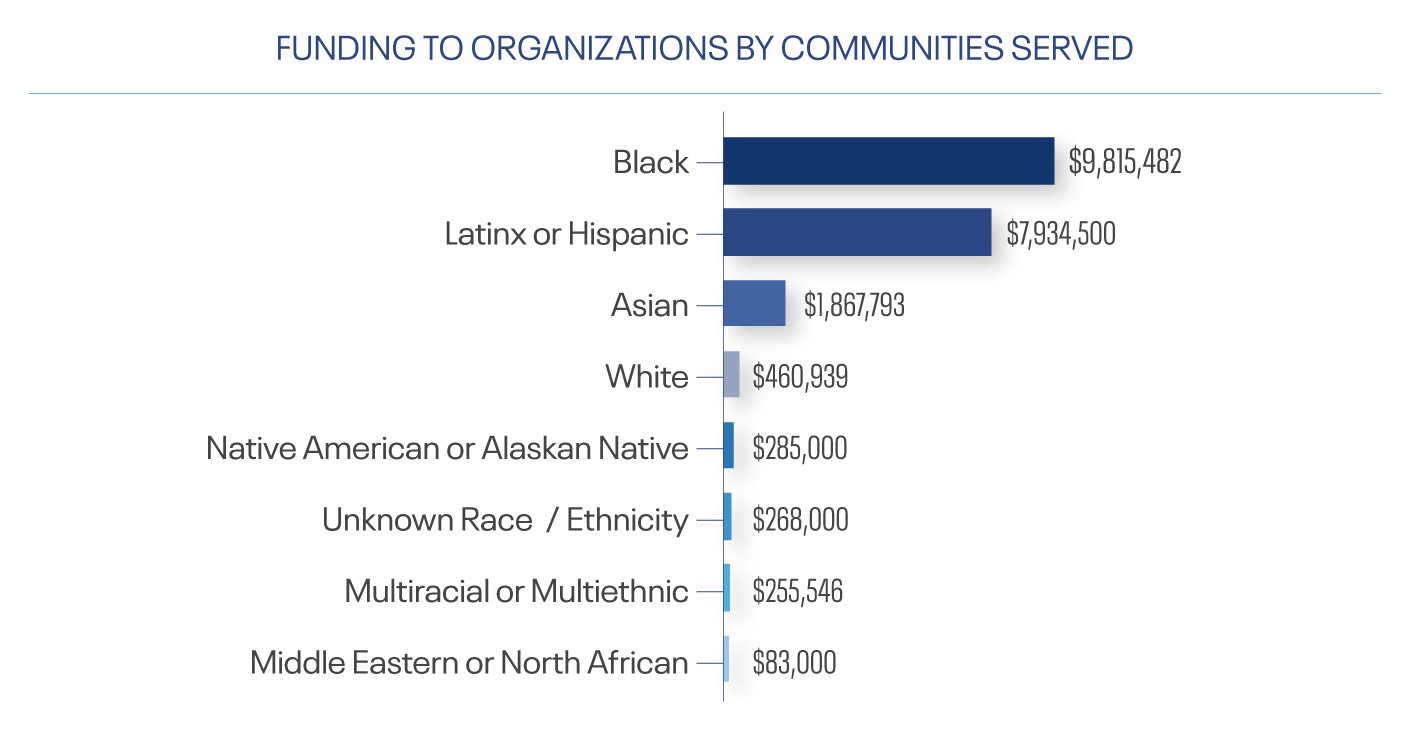
Of organizations with information on communities served, 95% served majority BIPOC communities.
Funding to organizations working with majority Black communities was $9.8 million, followed by Latinx ($7.9 million) and Asian ($1.9 million) communities.
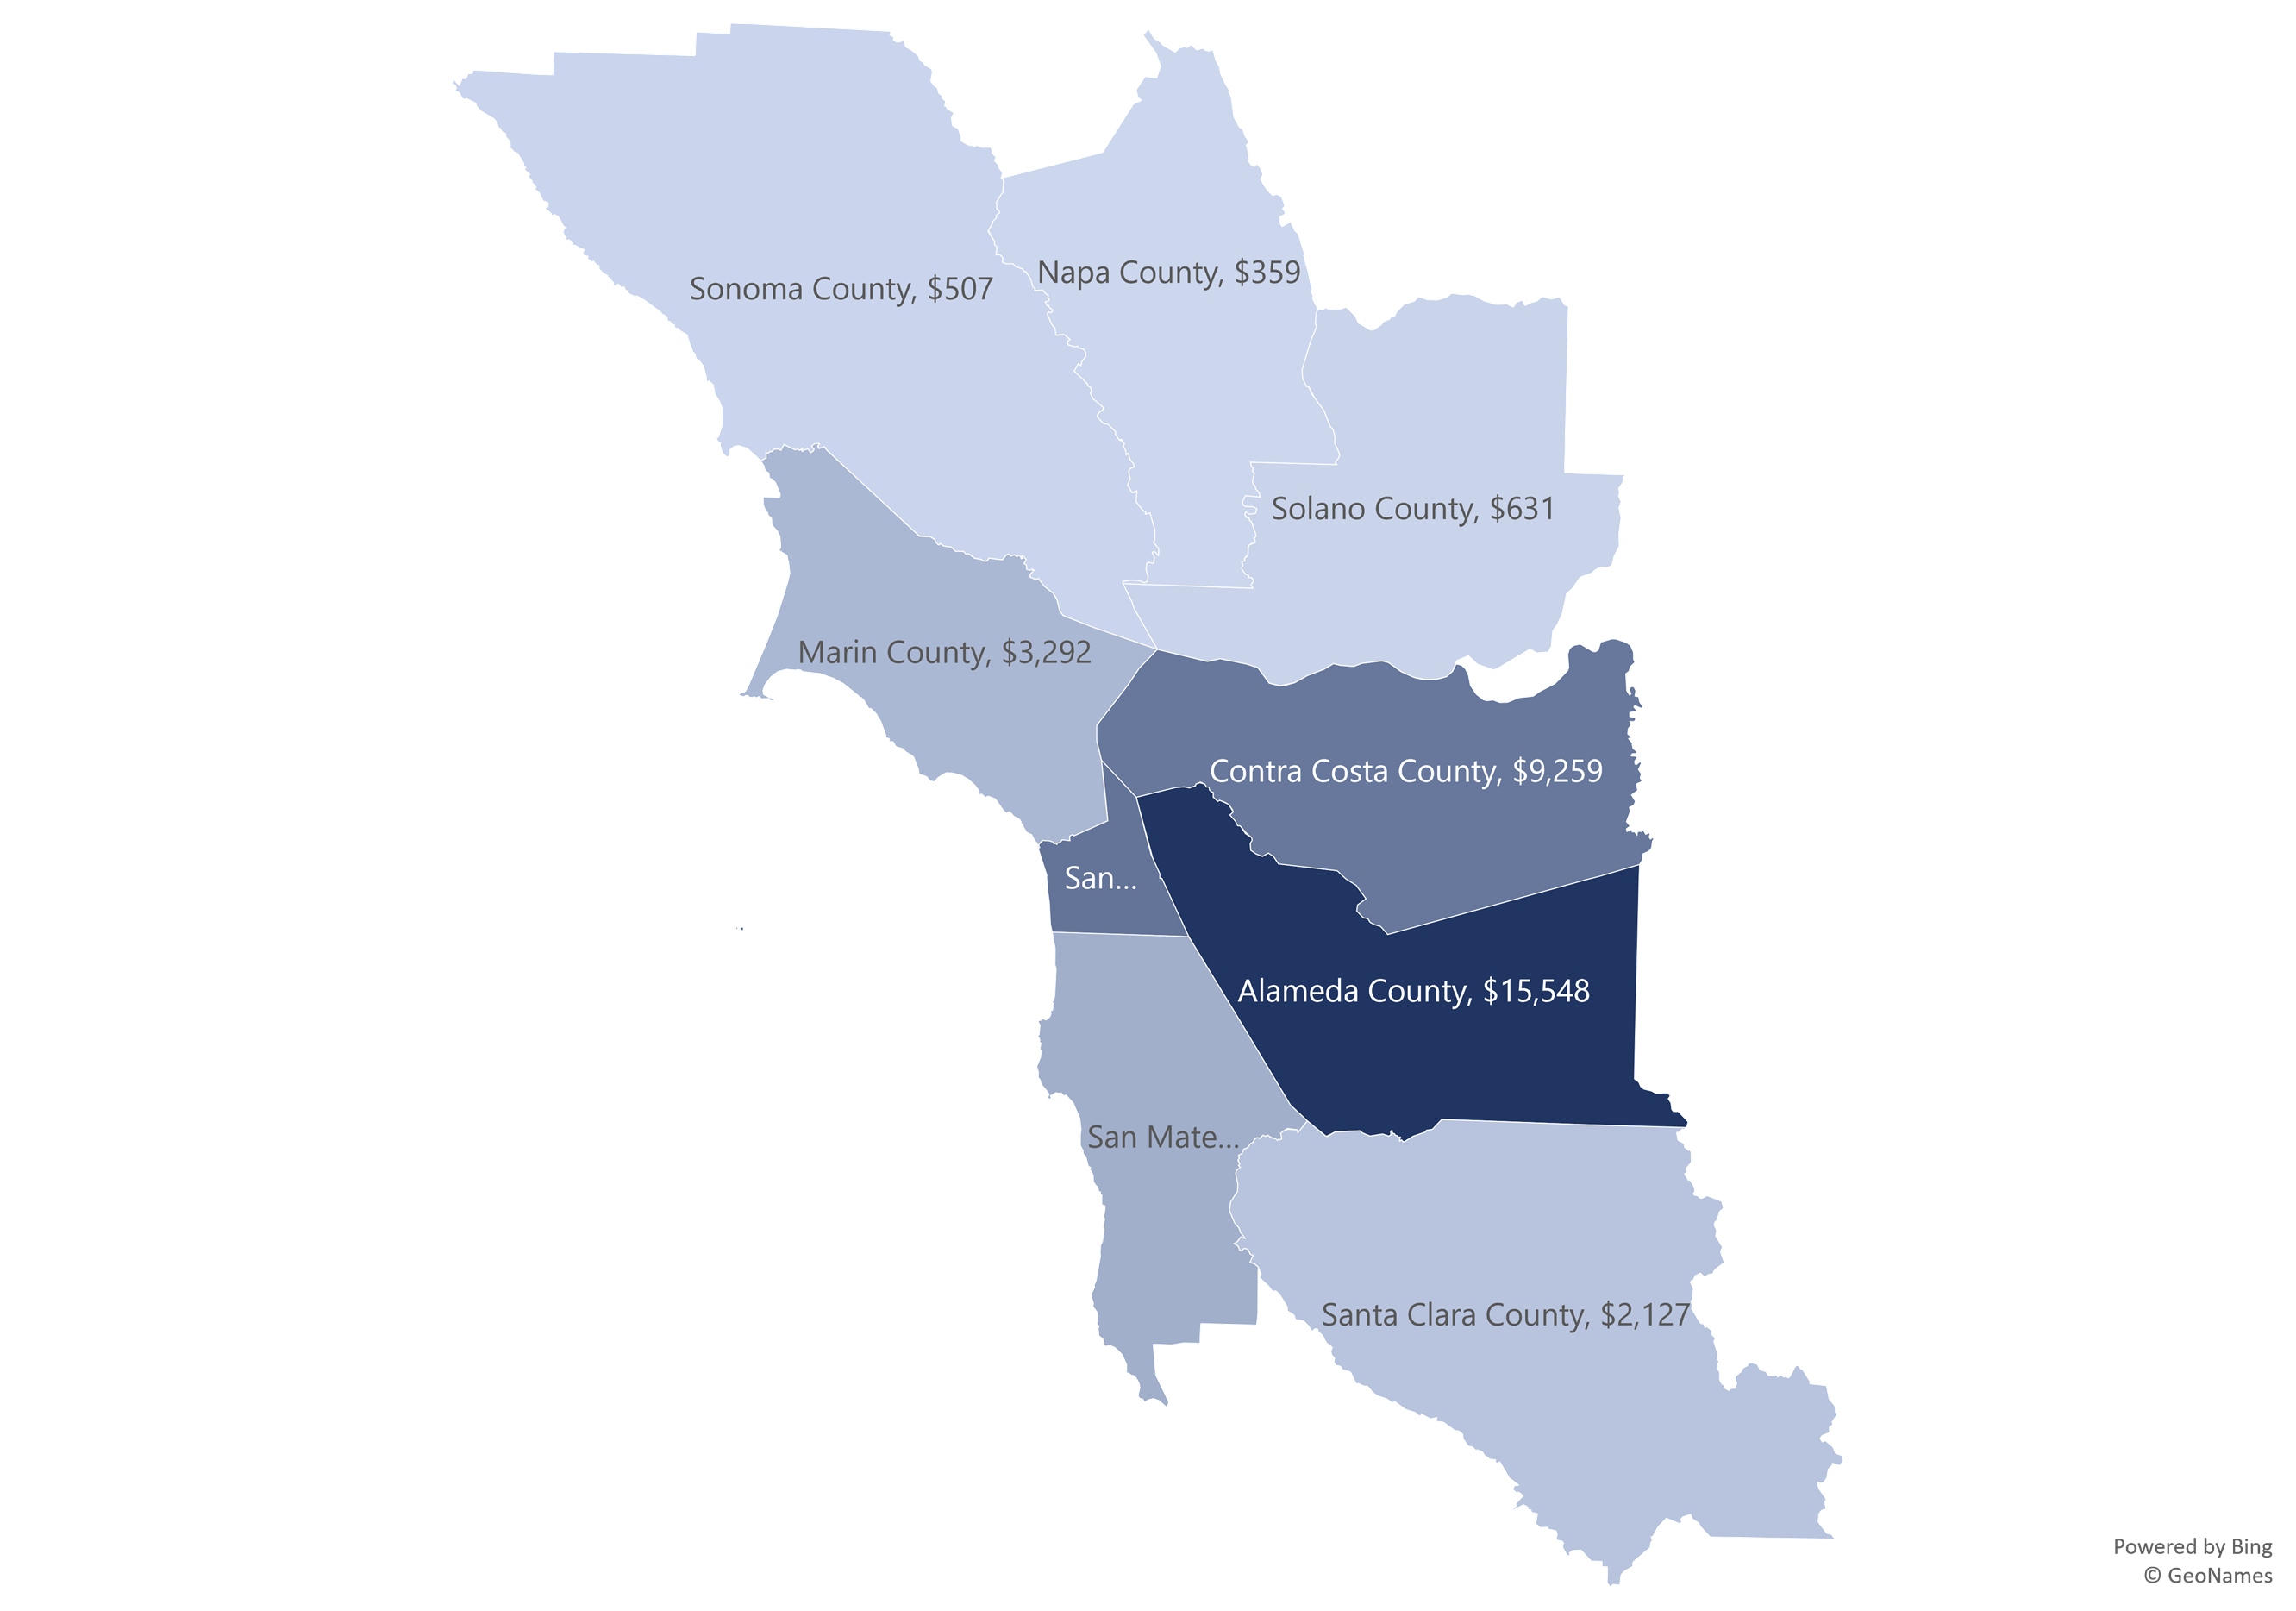
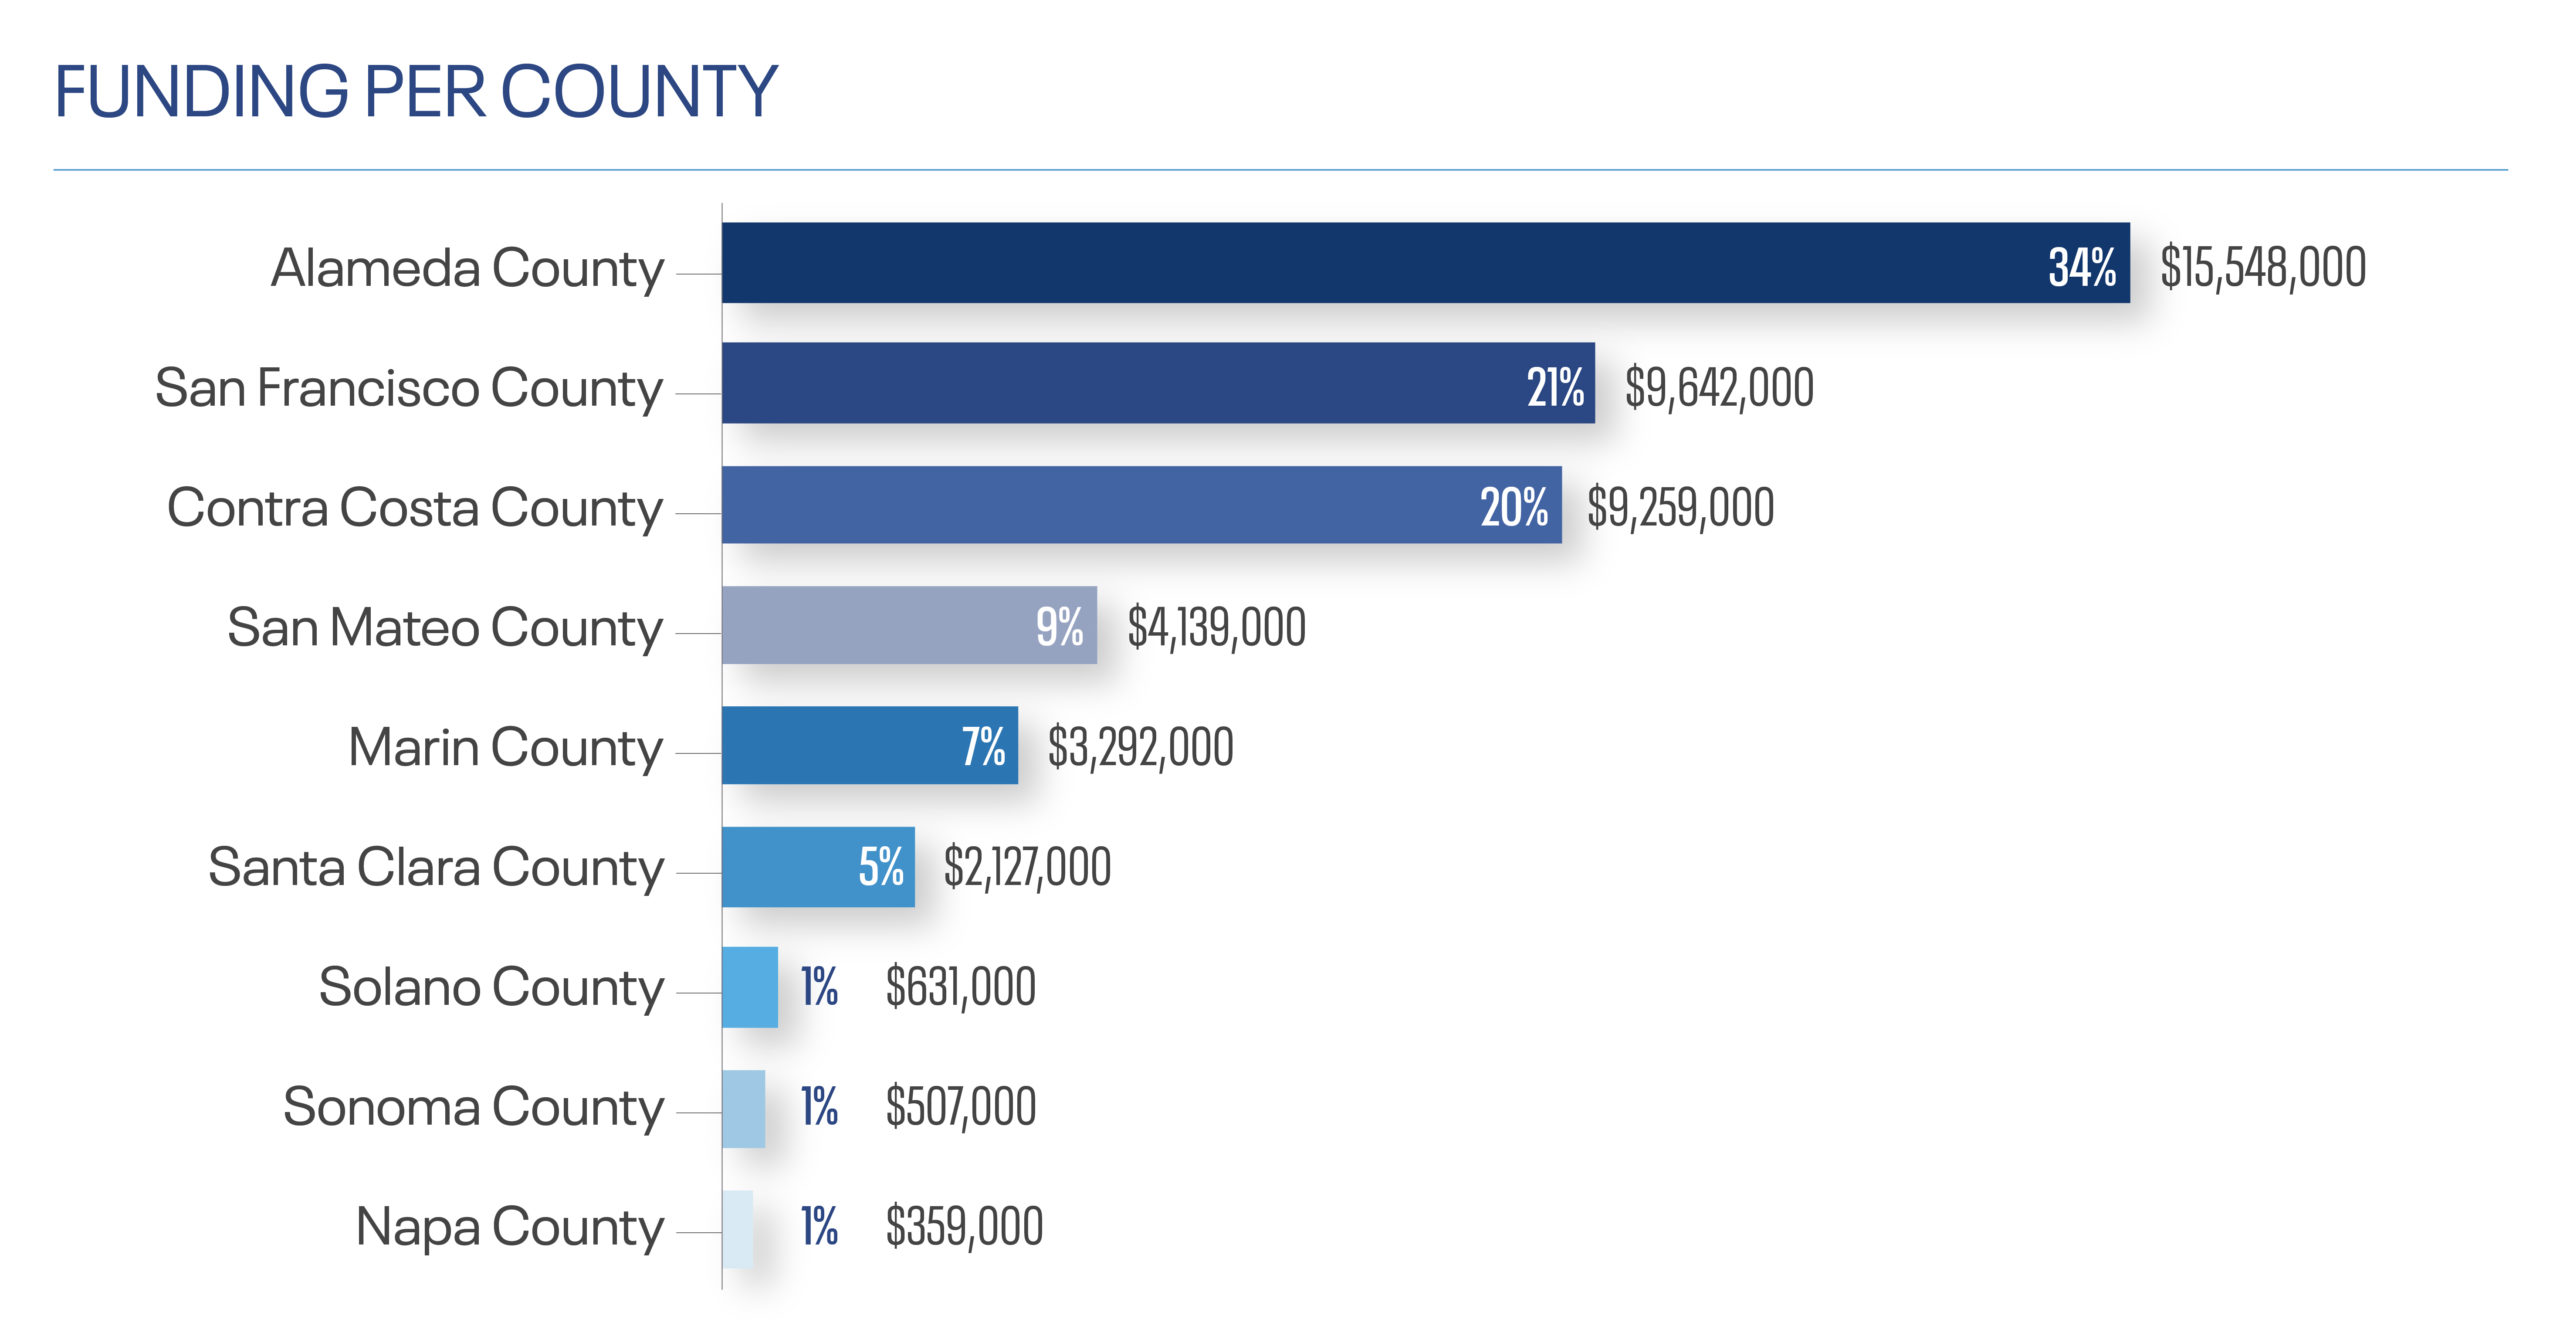
Geography
Organizations working in centrally located Bay Area counties received majority of funding (Alameda, San Francisco, and Contra Costa). Funding allocated equally across all counties in which grantees work.
Data and Methodology
This analysis reflects our latest completed fiscal year, which ended on June 30, 2022. Data is collected from a dataset generated from SFF’s revised grant application and organizational profile, which asks grantees to share information about demographics, organizational characteristics, grant strategies, and more. For this analysis, we draw on available data that is required for a subset of our grants. Across all grants, the completeness of data ranges from 76% (organizational budget) to 89% (regions served). We analyzed the data across all of SFF pathways and grantmaking initiatives by examining total funding and grant size by organizational characteristics (grants to BIPOC-led* organizations, including the EDs, organizational size), grant type (grant length, strategies), and populations served.
Read more about the launch of the 2021 grants data in a blog post by our Chief Impact Officer, Judith Bell.